Self-service analytics tools like Power BI and Tableau are catching on like wildfire in today’s business world. With them, business users and analysts are able to create powerful visualizations without involving IT.
But, before data can be consumed by these types of tools, it often requires extensive transformation, validation and aggregation. For this, analysts often use complicated formulas in Excel, repeating the process every time the report needs to be updated. Not only does this practice waste time and money, it isn’t scalable.
All that manual manipulation and transforming of data leads to a host of problems including
- Redundancies and inaccuracies
- Difficulty adding in new data sources
- Performance limitations
- Security issues

Redundancies and inaccuracies
In its native state, data is not typically in a format that can be readily used by these self-service visualization tools. Data often needs to be summarized, filtered and reformatted beforehand to make sense for business needs. For example, your raw data might include all transactions for your company, but you only want to report on specific divisions, products or timeframes so you filter this out in Excel. Or, you have invoice data in one Excel spreadsheet and division name in another, so you use VLOOKUP in Excel to merge them.
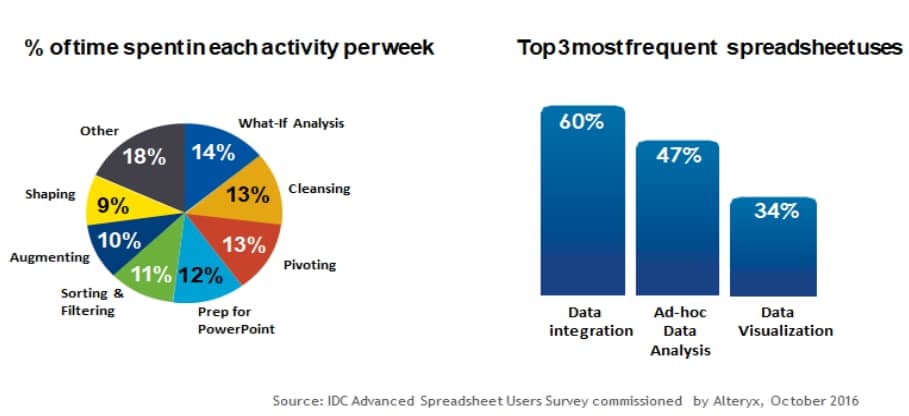
According to Gartner, 80% of an analyst’s time is spent applying “business-logic” and manually transforming data so it can be used in a visualization tool.* It is estimated that companies waste over $60 billion annually by manually scrubbing data in Excel. Because every analyst has his or her own way of performing these “transformations,” different versions of the data come into existence.
This duplication of effort and the lack of data consistency cause problems. Since each transformation in Excel uses different formulas, numbers don’t match up. To further complicate matters, this task is typically performed by one person who knows the data really well. If that person leaves, this knowledge often goes with her/him.
$60 billion wasted in the U.S. every year by advanced spreadsheet users*
Difficulty adding in new data sources
 The more visualizations you show people, the more they want. Analysts often hear something like “Great! Now that we have our actual numbers in this visualization, I want to see the budget numbers along-side them. And we budget at a quarterly level, six months ahead and the actuals are monthly” or “I want to compare this year’s sales by store to last year’s sales by store, and some of our stores quadrupled in size and I want an apples-to-apples comparison.”
To address these requests, analysts are constantly revising Excel data sources, adding new columns and trying to manually merge in new data. All that is difficult and time-consuming, especially if the data is at different levels of detail (i.e. yearly level verses monthly). Merging in new data can cause the Excel spreadsheet to grow to hundreds of columns, which is a nightmare to scroll through. In addition, as the number of data sources add up, manual processes to extract and transform become more complicated and the potential for inaccuracies and redundancies increase.
Performance limitations
Trying to merge more than two data sources in Excel can be thorny to say the least, especially if the sources have large volumes of data. As users add more spreadsheet columns and rows, they experience limitations and performance issues. A million rows of data stored in a modern database is not a problem, but a million rows of data in Excel can definitely be a problem!
Security issues
Another problem is security. To share Tableau content, packaged workbooks of the data and visualizations are often sent out. This method bypasses any security requirements that have been put in place by the company. A data repository helps address these problems. If the data source for a workbook is in a database, users can be required to sign-in for access. This enforces company security policies at the database level, the best place to enforce security rules.
Aside: If you are using Tableau and manageability and security become problematic, it is a good time to incorporate Tableau Server. With Tableau Server, data sources can be published and workbooks and dashboards can be organized into folders by business group (e.g. finance). Server lets you set up permissions for who can change data sources and workbooks. It can also be used to subscribe to content and refresh extracts on a schedule.
The answer: automating transformations and a data repository
So clearly, manual Excel data extraction and scrubbing is bad for your business analytics health. The solution to saving time and money and ensuring consistency in reporting lies in a two-fold process
- Automate the manual data transformation process using an ETL (Extract Transform and Load) tool. You can use standard ETL tools such as Microsoft SSIS or SQL or you can use self-service ETL tools such as Alteryx, which are built for business users.
- Store the clean data in a data repository, where it is consolidated and optimized for queries. The repository also provides business-friendly views of the data with easy to understand dimensions such as “Product” and “Location.” Drill down and aggregation can be built in to the architecture to provide both summary and detail data. As requirements change, new subject areas and data elements can easily be added, providing optimal flexibility.
If you have already automated your transformations and set up a data repository for Cognos or MicroStrategy, there is no need to start over when you move to Tableau. The Senturus Analytics Connector can access the business friendly data in Cognos.
Summary
If you are using modern self-service BI tools and are experiencing problems as you wrestle with Excel-based data sources, you are not alone. It’s time to move away from manual feats of heroism in Excel and move to an extensible, scalable data repository with automated ETL processes. By architecting your business analytics in such a manner, you will be much better positioned for meeting your needs now and in the future.
Senturus specializes in business analytics. We can provide experts adept in all aspects of BI including data architects, database experts, ETL experts and front-end visualization tool experts. We have the knowledge and expertise to guide you to make the right choices the first time, saving you money by preventing costly mistakes.
For more information on data repositories and best practices scaling Tableau use, see our on-demand webinar, Rolling Out Tableau to the Enterprise.
*IDC Advanced Users Survey, commissioned by Alteryx, October 2016.