Have you ever needed to do a little more in the way of data prep than what’s provided in the Tableau Data Source tab? If you are not a SQL expert, how do you do the prep required to make your data Tableau friendly? In the past, have you resorted to dumping data to a CSV file or Excel and using Excel for “cleaning” before bringing data into Tableau? What happens if you have multiple sources? Sure, some things can be done in Tableau Desktop using features such as cross-database joins and pivots, but it can be hard to generate repeatable steps that can be used to transform your data. And manual steps can be difficult to document and share with others. If these scenarios are painfully familiar to you, then Tableau Prep may be just what the (Tableau) doctor ordered.
Tableau Prep was announced under the name Project Maestro at the 2017 Tableau Conference and launched in April 2018. Under the new April 2018 licensing model, it comes with the Tableau Creator license (see Tableau Pricing). According to Tableau, “Tableau Prep will make it possible for more people, from IT to business users, to easily prep their data with a direct and visual approach.”
I recently had the chance to take part in the beta program for Tableau Prep/Project Maestro. While maybe not as fully featured as some ETL (extract, transformation and load) tools like Informatica and Alteryx, Tableau Prep has some nice features that should make life easier for relatively simple ETL scenarios.
Here’s a list of my 10 favorite features
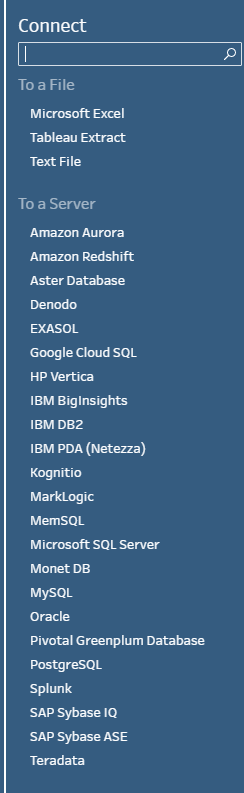
- Joining disparate data sources. For quite some time, one of Tableau’s strengths has been its ability to join multiple data sources. Tableau Desktop lets you combine sources by “joining” or “blending.” Similarly, Tableau Prep lets you combine an Oracle Table, a SQL Server table and a Microsoft Excel worksheet into one data source with just a couple of clicks.While some data prep can be done in Tableau Desktop’s data source tab, there are limitations to what can be done. The main differences between Tableau’s new Tableau Prep tool and data prep from within Tableau Desktopare in the presentation and in the number of options available.One such difference is that you can connect to 70 different data sources in Tableau Desktop and in the first production release of Tableau Prep, you can connect to 28 data sources. See below:

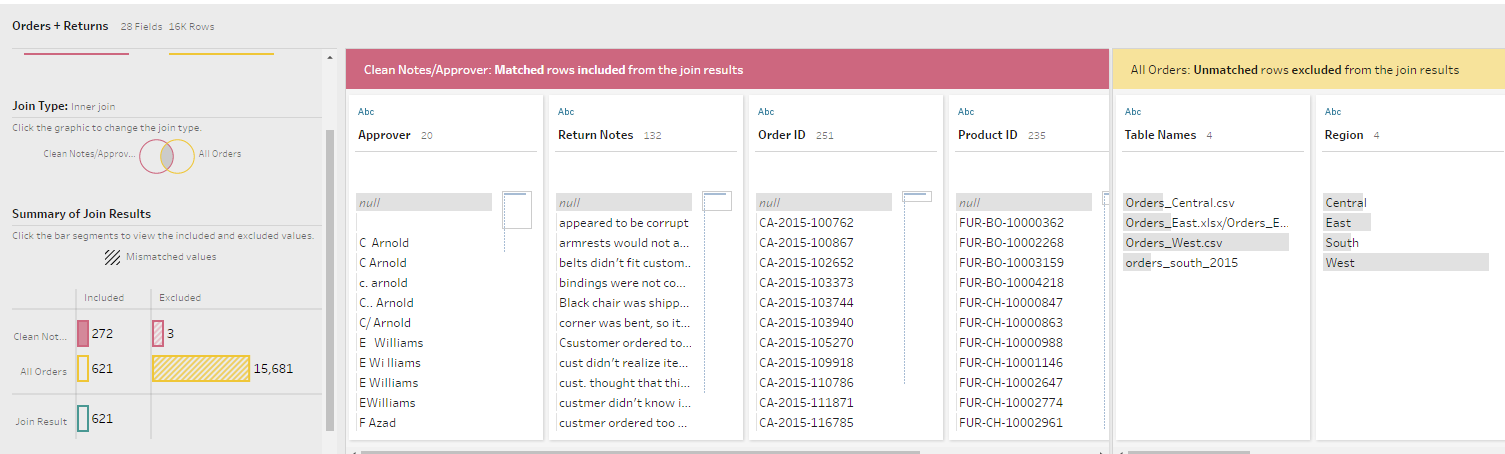
Within Tableau Prep, you add connections to these sources. If the connection is a database, such as SQL Server, you specify the schema, the tables and which columns you want to bring in. Once you have your sources set up, you draw a line between them and add a join.This functionality is similar to the way other ETL tools do joins. It should be pointed out that doing these joins is often easier said than done. When not dealing with simple data like Tableau’s Sample Superstore, joins can be tricky. This is often due to differences in the level of detail, mismatched data, etc. But if you have a relatively simple scenario, joining disparate sources can be accomplished in Tableau Prep.NOTE: Currently, the initial selection of schemas and tables is not quite as intuitive as with some data sources such as Oracle. As with Tableau Desktop, I expect every subsequent release will see improvement in this area. - Join and union results. With Tableau Desktop you can join data and union data. When doing a join or union in Tableau Desktop, the bottom of the Data Source tab will show your result. But often you want to see the results of what joined (given your join condition) AND what didn’t. In Tableau Prep, you get a Summary of Join Results that shows unmatched values. This feature can be useful for evaluating/debugging join conditions and for validating data.See the bottom right corner for an example of Summary Join Results.
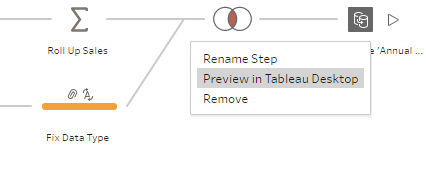
- Preview in Tableau Desktop. After you have done a “step” to transform your data, you can use Preview in Tableau Desktop to look at the data in Tableau Desktop. This feature provides a quick way to validate the data produced by the step.

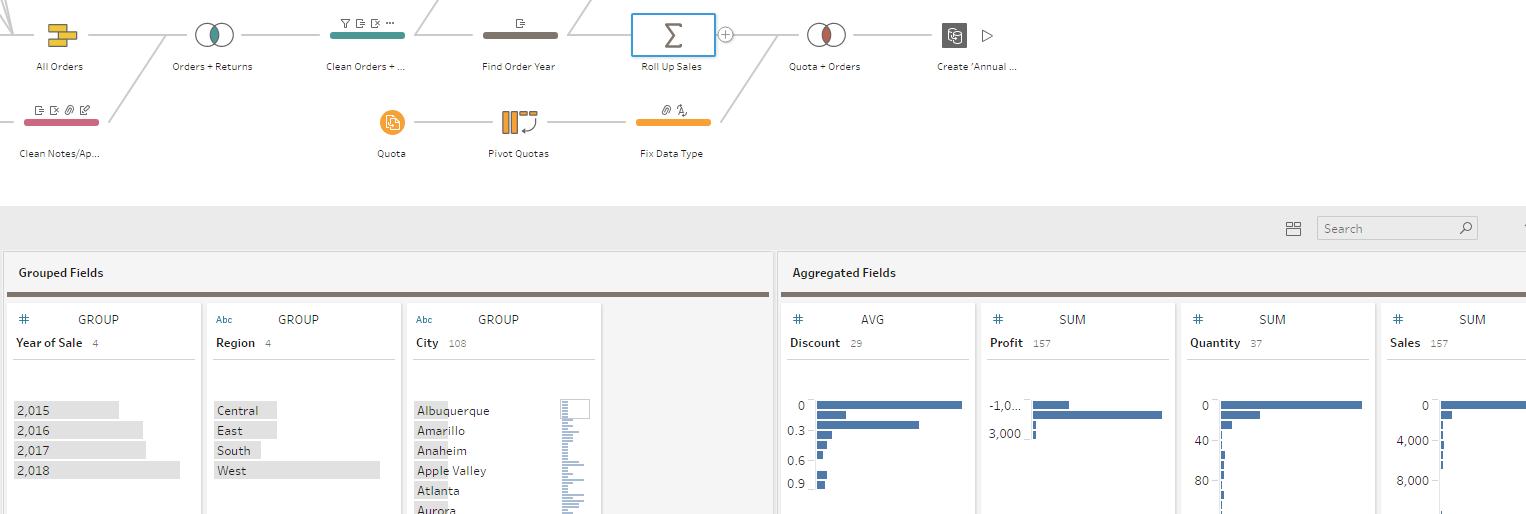
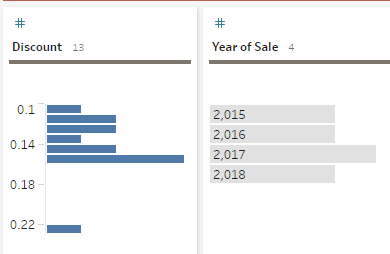
- Aggregate data. Tableau Desktop offers multiple ways to aggregate, or summarize, data. For example, you can create a Tableau extract and select Aggregate data for visible dimensions, or you can use sets or groups to aggregate data and summarizing into something like Total Sales by Region. But, if you just want a quick aggregation of your data to store in a data source or Tableau data extract (TDE), you can do this easily with Tableau Prep. You can add a step to aggregate and simply drag and drop your grouped fields and your aggregated fields. In the example below Discount, Profit, Quantity and Sales is grouped by Year of Sales, Region and City.

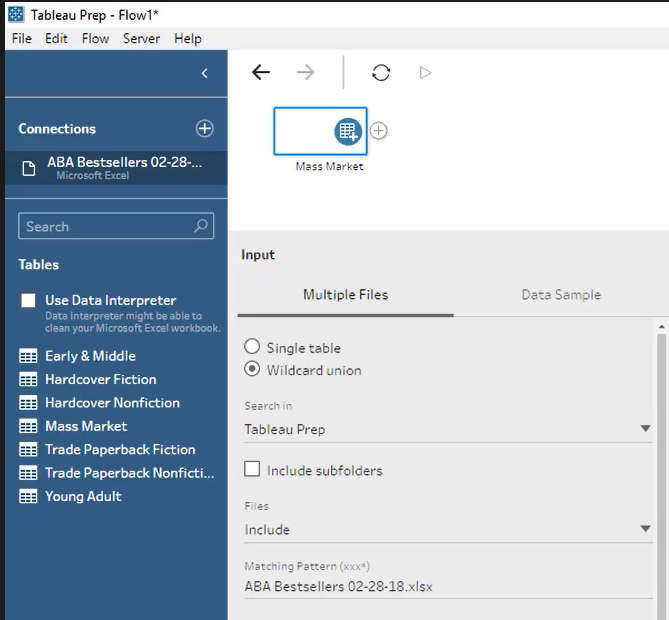
- Wildcard union. Sometimes you want to combine similar files into one data source (i.e. monthly sales files). In Tableau Desktop you can do a Union to accomplish this. Tableau Prep takes this to the next level by providing Wildcard Unions. With Wildcard Unions you specify a file path or directory and union all files that are in that location (irrelevant files can be excluded). You can then merge these files into one. The resulting merged file contains a File Paths column that contains the file path of the original source. When doing unions, you can also merge similar fields that have different names. See below for an example of a Wildcard Union:

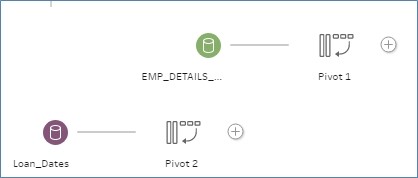
- Pivot for database tables. In Tableau Desktop, you can pivot data in Excel or CSV files. If you want to re-structure, or pivot, data stored in a database such as SQL Server or Oracle, you have to create a new table or use custom SQL. In Tableau Prep, “pivot” appears to be a valid option for database tables.Below are examples of pivots using SQL Server and Oracle tables as data sources:

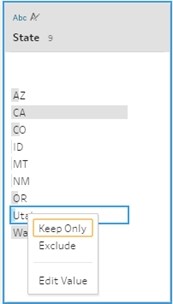
- Edit and clean data.This is big and has lots of use cases. Often when you bring data into Tableau, data integrity issues become apparent. Wouldn’t it be nice to quickly clean your data bringing it into Tableau? Let’s say most of your states were put in using a two-character capital abbreviation like AZ, but some states were fully spelled out. Ideally, you would fix data integrity issues at the source. But sometimes you just need a quick fix. With Tableau Prep you can now clean your data and edit values. See below for an example of edit values:

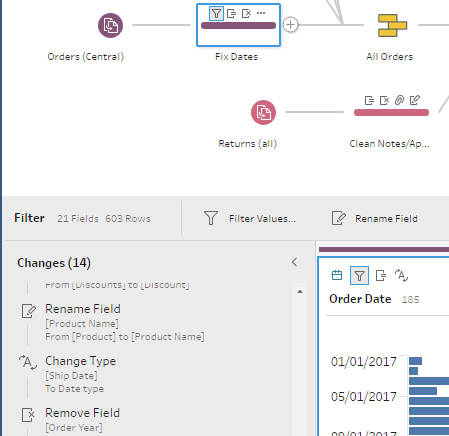
In Tableau Prep, you can create one step that does multiple “cleaning” functions like filter, change data types, rename and remove fields. See below for a “Fix Dates” step that performs multiple functions:
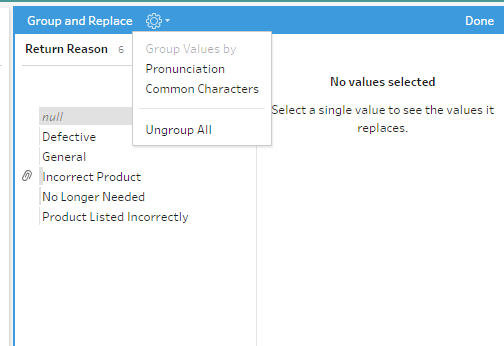
- Group and replace. Let’s say you have the following values “USA,” “United States” and “U.S.A.” You know these are all USA and should be grouped together. Currently, you can group these in Tableau Desktop or fix your data at the source. With Tableau Prep you also have an option to Group and Replace, saving your new grouping as part of your data source.See below for an example (notice you even can do it by Pronunciation!):
- Data profile. In Tableau Desktop’s Data Source pane, row level data is displayed at the bottom of the screen, but you can’t see how the data is distributed. With Tableau Prep, the screen is divided into three panes: the top pane has a data flow or a graphical representation of the work flow, the middle pane has a data summary or profile and the bottom pane displays the row level data. The profile section in the middle has histograms to depict the frequency of values within columns, making it very easy to see how data is distributed.See below:
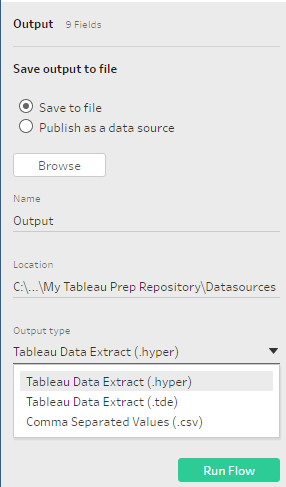
- Graphical depiction of steps taken to transform data. As you can see above, steps taken to transform the data are graphically depicted and put into one self-documenting flow. You can also click on any of the steps to see what the data looks like at any given stage of transformation. This is what more complex ETL tools have been doing for years and it is really useful. These steps can then be shared and run as a “flow,” which can be published as a Hyper, TDE or saved to a file.

Conclusion
Tableau Prep has some really good, time saving features that will allow you produce Tableau friendly data. It will be a good alternative to manually scrubbing data, using steps that often are not documented or repeatable. For simple transformation logic, Tableau Prep should do everything that is required. Even though Tableau Data Prep is good at creating Tableau Data Extracts and text-based files, often it can be better to build a database repository or data warehouse that can be leveraged by multiple reporting tools. For this type of work there are other ETL (extraction, transformation and load) tools that might better suit your needs. Tools such as Alteryx and Informatica have more data output options (i.e. database tables) and more capabilities when it comes to predictive modeling, statistical analysis, geospatial manipulation, mapping and valuable built-in demographic data for enhancing a dataset. At Senturus, we believe there is no one size fits all tool for data preparation. There is a “right tool for the job” and we can help you determine what tool might best fit your needs.
It is a well known fact that data preparation is often 80% of the work when building out business analytics frameworks. For more complex data work, expert advice is often needed to make sense of the underlying data sources so they can be joined into a cohesive, well-designed data model that can be used by multiple reporting tools. At Senturus, we have been doing just that for nearly two decades. We make sense of what is complex by designing and building intuitive data structures that can be easily leveraged by tools such as Tableau.
This blog was submitted by our own Monica Van Loon. A frequent contributor to our blog, Monica is a Tableau certified consultant and teaches many of our Tableau workshops.
Senturus is a nationwide business analytics consulting firm and a Tableau partner. We were in no part solicited or paid for this review. The views and opinions expressed in this article are those of the author and do not necessarily reflect those of any other related party.