The science and the art
of data storytelling
Well-executed dashboards, reports and visualizations represent the pinnacle of a great data analytics system. Part art form, part science, they use good design principles and leverage complex data formulas to clearly and quickly convey the vital information that allows businesses to evolve into competitive data-driven organizations. When supported by well-structured and modeled data, these data stories catapult from pretty to powerful, opening wide the doors for ROI.
- Easily track, view and access key performance indicators (KPIs).
- View underlying business drivers in reports with a single click.
- Facilitate data discovery and widespread adoption of self-service.
- Speed time to insights by automating time consuming, error prone manual efforts.
- Confidently and securely get and share reports in the desired format.
- Enjoy fast, timely access to data.
- View reports and dashboards that refresh in near real-time.
Where pretty meets powerful
At Senturus, we live at the intersection of data artisan and data ninja. We bridge the gap between IT and business, working closely with both groups to align your analytics technology to your business drivers. The reports, visualizations and dashboards we deliver aren’t just eye-catching, they are optimized for speed, security and communication.
Featured services
BI tool comparison
An unbiased assessment of BI tools against your business needs that helps you select the right one(s) for your organization. Learn more
Tableau jumpstart program
Hands-on guidance to ensure the successful rollout of Tableau to your organization, includes architectural review, proof of concept and dashboarding best practices. Learn more
Cognos licensing renewal review
A free service to optimize your IBM analytics software subscription and renewals process. Learn more
Migrations
We will move you into a stable new environment cost effectively, with minimal downtime. Learn more
Webinars, blogs, videos & whitepapers

Dashboard, report &
visualization training
Whatever your role or experience level, we have Power BI, Cognos and Tableau classes for you and in a learning format that makes best sense for your organization and learning style.
View courses
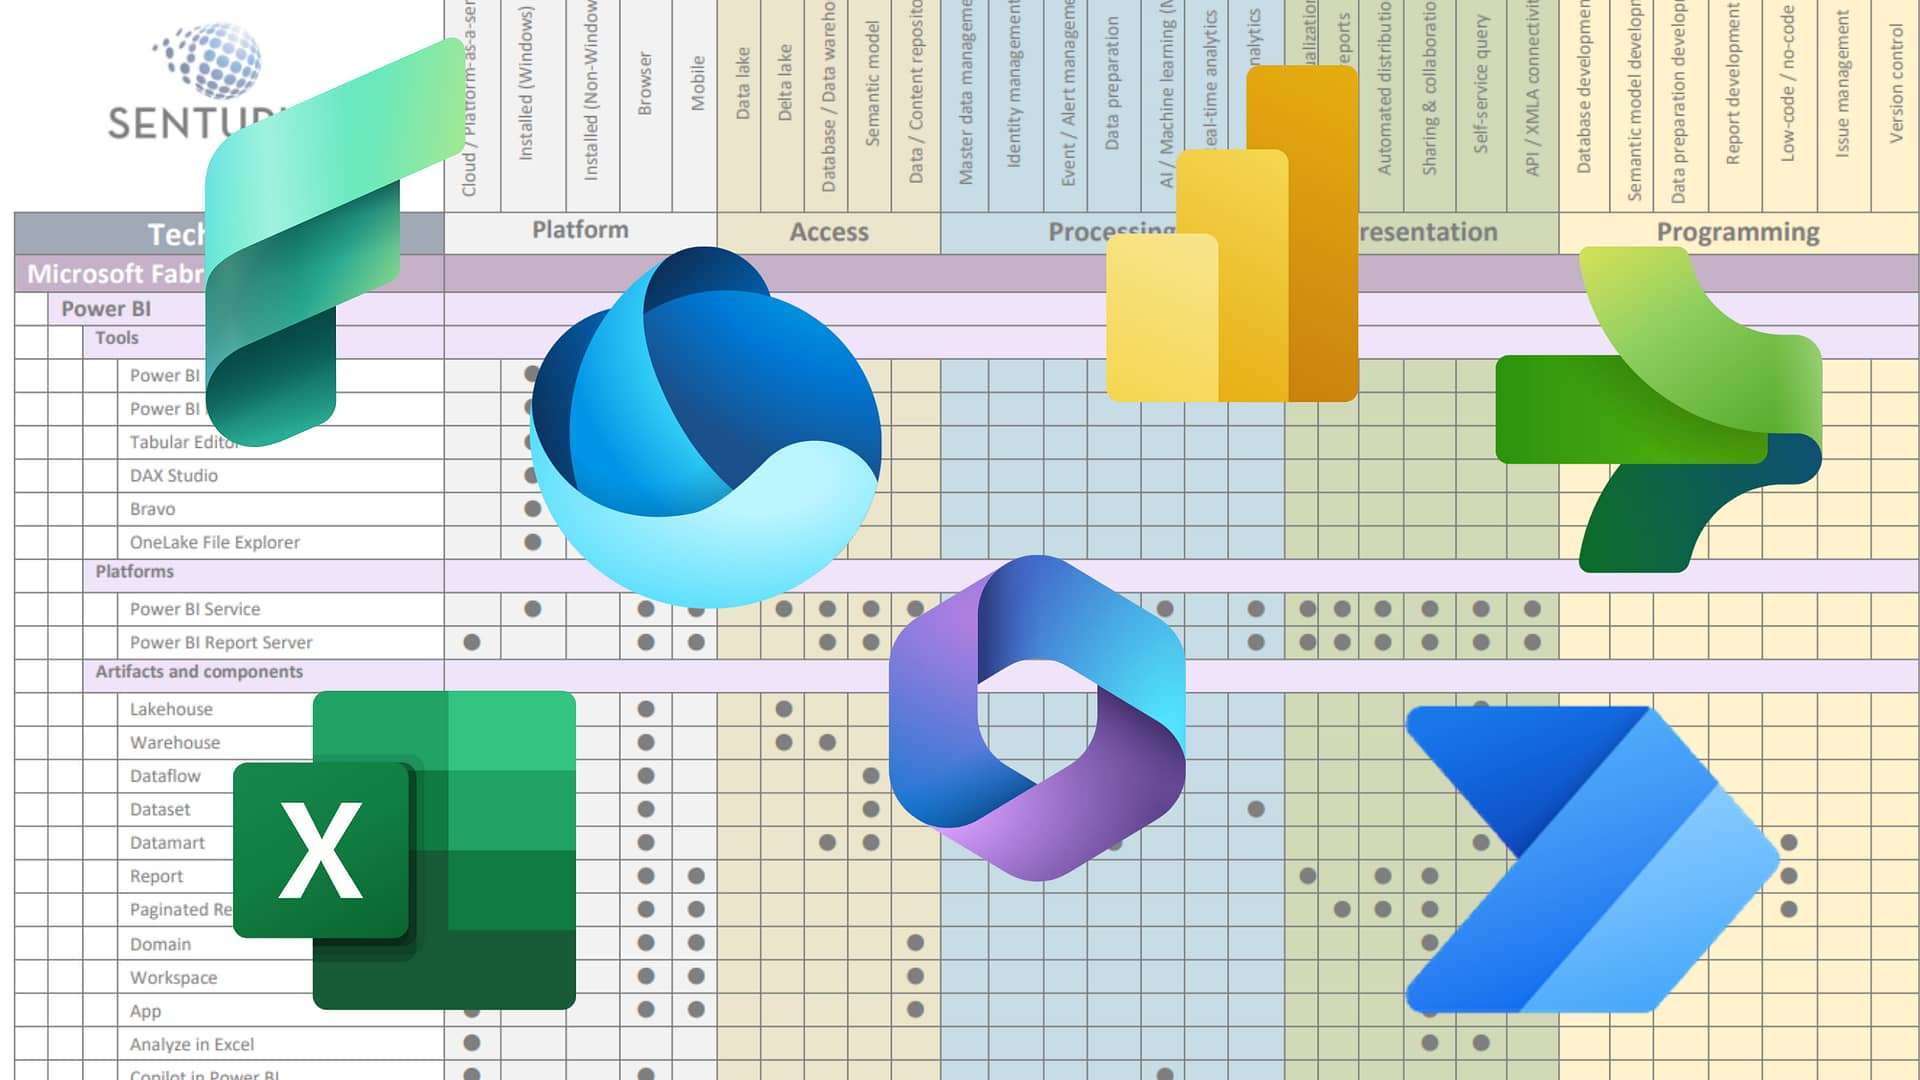
Business Intelligence platforms